High Resolution Bar Graphs For The Pet
David C. Swaim
Atlanta, GA
One of the reasons I chose the PET when I bought my computer was its excellent graphics capabilities. The PET/CBM graphics character set can be used to make "double density" or "high resolution" graphs without resorting to additional hardware. The highest resolution can be achieved when using bar graphs. Bar graphs can be found regularly in the financial section of the newspaper and are used to illustrate everything from the yearly rise in prices to the yearly production of wheat. You can draw bar graphs on your PET easily. What I want to describe in this article is a method I use.
How It Was Done
The first program I wrote to draw a bar graph used the reversed space to draw the bar. These bars looked fine but there were only about 20 steps vertically or 35 horizontally (allowing some space for labels). I wanted higher resolution than that for my graphs. It is possible to increase the resolution by a factor of eight either horizontally or vertically. All I had to do was use the other characters needed along with my reversed spaces. I put the needed graphics characters in an array. First I needed to plot the proper number of whole spaces for the bar. This was done by dividing the value to be plotted by the value I chose to be the maximum allowable value (the value that would give me a complete solid bar). This gave me a fraction that I multiplied by 20 (my vertical bar is 20 lines tall) and the result was truncated to an integer value, i.e., the fractional part was dropped (in my "low resolution" program the result was rounded to the nearest integer). This is an important difference. This integer corresponded to the number of times I would print a reversed space. The graphics character to be used for the last space was found by taking the fractional part from the original calculation of length and multiplying it by eight. This number was rounded to the nearest integer value and used as the index of my character array. Thus the proper character was printed to finish the bar.
The Program
The program listed here is a general purpose bar graphing program illustrating the high resolution bars. The bar graph is loaded into an array first before it is plotted on the screen. This is done for flexibility. To switch from vertical to horizontal graphs requires rewriting only the print routine (lines 1000 and up) and putting the appropriate graphics characters in the array X$ (lines 110 and 115). The rest of the program remains the same. You can change the data plotted by retyping the DATA statement (line 150) and changing the heading in K$ (line 160). You do not need to worry about the maximum value of the data. The program calculates (on line 280) a maximum bar length so that the largest data value is plotted nine-tenths of the maximum allowable bar length. If you prefer line 280 can be changed to set a definite ceiling. Be careful though. The program is not protected against data larger than the maximum bar length.
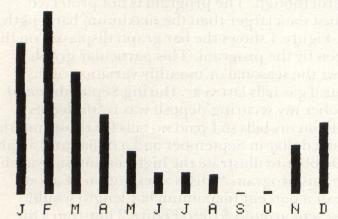
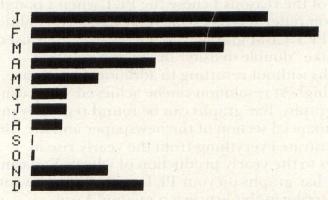
Figure 1 shows the bar graph displayed on the screen by the program. This particular graph shows the seasonal or monthly variation of my natural gas bills last year. During September and October my securing deposit was refunded as a credit on my bills so I paid no bills for those months. I put a dollar in September and a dollar and a half in October to illustrate the high resolution available with this program. This is a resolution of about half of a percent (maximum bar length would represent around $100). Figure 2 illustrates the same data printed with a horizontal format. Try it and I'm sure you'll never be satisfied with "low resolution" graphs again.
10 REM ************************
60 REM ************************
100 DIM M$ (11, 20), Y(12), X$(8)
105 REM X$ CONTAINS GRAPHICS CHARACTERS
106 REM FOR MAKING THE BAR
110 X$(1) = "$": X$(2) = "o": X$(3) = "y": X$(4) = "b": X$(5) = "{REV}x{OFF}": X$(6) = "{REV}w{OFF}"
115 X$(7) = "{REV}c{OFF}": X$(8) = "{REV}{OFF}"
119 REM MOVE CURSOR DOWN CHARACTERS
120 P$ = "{24 DOWN}"
125 REM HOME AND UP, BACK CHARACTERS
130 H$ = "{HOME}": U$ = "{UP}{LEFT}"
140 REM DATA TO BE PLOTTED ON THE BAR
150 DATA 75.36, 91.53, 61.29, 39.56, 21.78, 11.4, 11.39, 10, 1, 1.5, 24.69, 35.67
155 REM K$ IS THE TITLE OF THE GRAPH
160 K$ = "NATURAL GAS BILLS"
190 REM READ THE VALUES TO BE PLOTTED
200 FOR X = l TO 12
210 READ Y(X)
220 NEXT X
230 Y(0) = Y(1)
250 FOR X = 2 TO 12
260 IF Y(X)>Y(0) THEN Y(0) = Y(X)
270 NEXT X
275 REM SET MAXIMUM BAR LENGTH, Y(0),
276 REM TO BE 10/9 TIMES LARGEST VALUE
280 Y(0) = 10*Y(0)/9
300 FOR M = 1 TO 12
301 N = M-1
305 REM CALCULATE THE NUMBER OF PRINT
306 REM LINES LONG THE BAR WILL BE
310 Z = Y(M)*20/Y(0)
315 REM Z% IS NUMBER OF WHOLE LINES
316 REM TALL THEN BAR IS
320 Z% = INT(Z)
325 REM R% IS NUMBER OF RASTER LINES
326 REM TO BE PRINTED ON THE Z% + 1
330 R% = INT((Z-Z%)*8)
336 IF Z% = 0 THEN 530
500 FOR P = 1 TO Z%
510 M$ (N,P) = X$(8)
520 NEXT P
530 IF R% = 0 THEN 550
540 M$(N, Z% + 1)= X$ (R%)
550 NEXT M
1000 REM PRINT THE BAR GRAPH
1004 PRINT"{CLEAR}"
1005 REM WRITE THE GRAPH TITLE
1006 PRINT SPC(20-LEN(K$)/2);K$
1009 REM PUT BAR IDENT. AT BOTTOME OF SCREEN
1010 PRINT "{HOME}";P$;"  J  F  M A~ M  J  J  A  S  O  N  D";
1020 FOR M = 1 TO 12
1021 N = M-1
1025 REM POSITION CURSOR READY TO DRAW
1026 REM THE NEXT BAR
1030 PRINT H$;LEFT$(P$, 21);SPC(3*M);
1035 REM DRAW THE ENTIRE BAR INCLUDING BLANKS
1040 FOR B = 1 TO 20
1050 PRINT M$(N, B);U$;
1060 NEXT B
1070 NEXT M
1080 GETA$ : IFA$ = ""THEN 1080
1100 END
READY.