Moving Averages
Jerry W. O'Dell
Eastern Michigan University
The Microsoft Version of this program will work on Apple, OSI, PET/CBM, and any Microsoft BASIC computer which has enough memory to absorb the dimensioning in line 40. Changes for the Atari are in Program 2.
One of the nice things about having a microcomputer in your business is the fact that you can do calculations easily that would be almost impossible to do by hand. A good example of this is the moving average. They are commonly used in businesses (we'll see why in a minute), and yet they are a perfect nightmare to calculate by hand. I'll bet that it would take a whole day to do one, and then it probably wouldn't be right.
What is the moving average? This is best explained by using some data. Table 1 contains American Stock Exchange indices, by month, for the boom years of 1963 to 1968. The problem involves whether there are systematic monthly variations in AMEX prices. There are theories in the stock market that prices go up during certain times of the year. Is there any truth to this?
| Table 1. | ||||||||||||
| Jan | Feb | Mar | Apr | May | Jun | Jul | Aug | Sep | Oct | Nov | Dec | |
| 1963 | 7.5 | 7.6 | 7.5 | 7.7 | 8.5 | 8.6 | 8.6 | 8.6 | 9.0 | 9.1 | 9.0 | 8.5 |
| 1964 | 8.9 | 9.0 | 9.2 | 9.2 | 9.1 | 9.2 | 9.7 | 9.7 | 10.2 | 10.3 | 10.4 | 10.2 |
| 1965 | 11.0 | 11.5 | 11.7 | 12.0 | 12.1 | 11.5 | 11.0 | 11.5 | 12.0 | 12.5 | 13.5 | 14.5 |
| 1966 | 15.0 | 16.0 | 15.9 | 16.5 | 16.3 | 15.5 | 15.4 | 14.0 | 13.0 | 12.5 | 12.6 | 13.0 |
| 1967 | 14.9 | 16.0 | 17.0 | 17.8 | 19.0 | 19.0 | 20.5 | 22.5 | 22.6 | 22.8 | 22.0 | 24.0 |
| 1968 | 25.0 | 23.8 | 22.0 | 24.0 | 27.2 | 29.5 | 28.5 | 26.5 | 29.5 | 30.8 | 31.5 | 33.0 |
| Simple Average | 13.7 | 14.0 | 13.9 | 14.5 | 15.4 | 15.6 | 15.6 | 15.5 | 16.1 | 16.5 | 17.2 | |
| % Simple Average | 89.4 | 91.1 | 90.4 | 94.7 | 100.1 | 101.3 | 101.7 | 100.8 | 104.6 | 106.4 | $07.5 | 112.1 |
| % Moving Average | 101.1 | 102.1 | 100.5 | 102.4 | 103.8 | 101.5 | 100.2 | 99.1 | 98.7 | 97.5 | 96.5 | 96.7 |
In Table 1, the simple average is just the plain old average that everyone knows how to figure, for each month. The row, "% simple average," is calculated by dividing the simple average values by the overall average (15.35) and multiplying by 100. These percentages are plotted in Figure 1 as the "simple average" values. The plot was done by an expensive CalComp plotter on a large computer (but you could do as well with a MIPLOT, I'll bet).
Figure 1.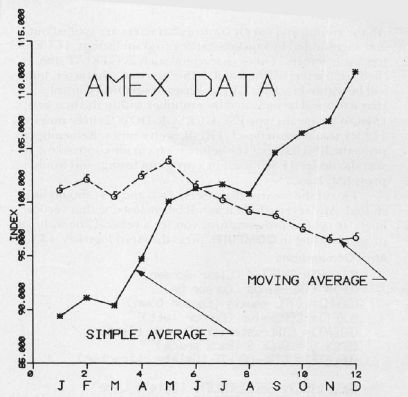
Look at the figure and the values in the "% simple average" row. Notice that they keep going up throughout the year. Aha! We can conclude from the AMEX data that stock prices gradually go up during the year. If we buy stocks in January, then we can make a killing of about 20% during the year. It sounds too good to be true. What is going on?
The confusing factor is simply the fact that the prices increased continuously throughout the period; it's called inflation! Oh, there are few places in which prices went back for a month, but that's rare. If a constant factor, such as inflation, gradually and relentlessly pushes prices up, it will show up in these simple averages. Statisticians call such factors secular trends, but you can see how they work without all the fancy terminology.
Eliminating Secular Trends
What is needed is some way of getting rid of the secular trend. There are many ways of doing this, and many variations on the many ways, but perhaps the most widely used method is called the moving average. The moving average is the other line in Figure 1, and it removes the trend. Notice here that, instead of stock prices going up during the year, with the moving average method, we find that prices go down a bit. They don't go down a lot, only from about 102% to 97%, but the real direction, with the trend removed, is slightly downward.
In short, moving averages lead to precisely the opposite conslusion in this case. You shouldn't buy in January and sell in December. With moving averages, you'd buy in December, and sell in May.
Moving averages are useful. Now, how do you calculate them? That is a complicated business! What you do is add up the twelve months surrounding each month, and get an average for each month (for each year) from that. The trouble with that is that this gives you halfway month sums (June-July, say). So then you have to average those to get back to whole months. And on and on. Obviously, it's too complicated to explain in full here. If you want details, look at McElroy's Applied Business Statistics (Chapter 13), or Storkton and Clark's Introduction to Business and Economic Statistics. The explanation takes pages.
With your microcomputer you can simply type in Program 1, and it will do all the work for you. The listing has comments for those interested in how the program works, but I'd leave them out. They'll only slow down the program and, after all, you have a copy (this one!) of the comments.
The data is put in, by year, in the DATA statements at the bottom. And you have to put in the number of years, in line 30. Then the program takes over and is finished in about 30 seconds.
Are Moving Averages Always Reliable?
Do moving averages always smooth out data? Not if there is a real monthly variation. Take, for example, Figure 2, which is a plot of the quantity of fish taken (in millions of pounds) from Lake Michigan in the years 1952-1957. One curve is the simple average, and the other curve is the moving average. Notice here that the two curves are almost identical, so much so that I didn't try to identify them. Here, there really is a seasonal variation, and it shows up even when the long term trend is removed. It's obvious that you should go fishing in April and November, and avoid June, July, and August, when most people, of course, go fishing (data from Michigan Department of Conservation).
Figure 2.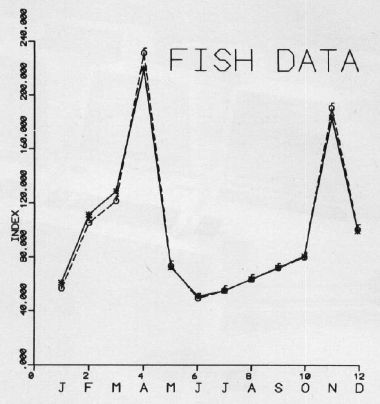
You can do moving averages in about 30 seconds that would take many hours to do by hand. And, if you're making business decisions, you'd better do so, if you suspect monthly trends.
A few warnings are in order. There are all sorts of moving averages: you can do them monthly, quarterly, and I think that in the stock market they do them at 29 day intervals. The program can be changed to do that, if you change the indices. And there are variations in the way people calculate them. Some people use medians, some drop extreme values, and so on.
The program has been carefully tested. There is one potential problem, however, that might crop up on some other computers. Some of the subscripts on some of the variables may go out of range occasionally, and refer to values that don't exist. I like my programs to be as simple as possible, and the BASICs that I've tried are very forgiving in that way. However, perhaps somewhere someone has a BASIC that won't be that nice, and you might have to add some statements to fix that; it would make the program a good deal longer, so I didn't. As listed the program will handle 20 years. If you want more years, you'll have to change the dimension statements in line 40 (12 times the number of years desired).
Program 1: Microsoft Version10 REM MOVING AVERAGE PROGRAM 20 REM CHANGE N TO SUIT N OF YEARS 30 N = 6 40 DIM IN(240), SM(240), Y(240), Z(12), MO$(12) 50 DATA "JANUARY ","FEBRUARY ","MARC H ","APRIL " 60 DATA "MAY ","JUNE ","JULY ","AUGUST " 70 DATA "SEPTEMBER","OCTOBER ","NOVEMBER ","DECEMBER " 80 FOR I=1 TO 12 90 READ MO$(I) :REM READ PRINTOUT ˜ HDRS 100 NEXT I 110 T=N*12 :REM TOTAL N OF MONTHS 120 KV=0 :REM COUNTER FOR MONTHS 130 FOR I=1 TO N :REM LOOP TO READ ˜ YRS 140 FOR J=1 TO 12 :REM LOOP TO RD ˜ MOS 150 KV=KV+1 160 READ IN(KV) :REM READ IN DATA 170 NEXT J 180 NEXT I 190 KB=5 :REM ST COUNT B AT JUNE 200 KM=T-12 210 FOR I=1 TO N :REM BIG LOOP FOR ˜ HWY 220 FOR J=l TO 12 :REM LOOP FOR MOS 230 KB=KB+1 240 KC=KB-6 :REM INDEX FOR WHOLE YR 250 FOR K=1 TO 12 260 KC=KC+1 270 SM(KB)=SM(KB)+IN(KC) :REM HF MO SUMS 280 NEXT K 290 NEXT J 300 NEXT I 310 FOR J=6 TO (T-7) :REM RANGES FOR 4 320 Y(J+1)=(IN(J+1)/((SM(J)+SM(J+1))/24))*100 330 NEXT J 340 FOR I=1 TO 12 :REM MAIN SUM LP 350 KQ=I+6 360 IF KQ<13 THEN 380 370 KQ=KQ-12 380 KR=KQ 390 FOR J=1 TO N :REM LOOP FOR YEARS 400 Z(KQ)=Z(KQ) + (Y(KR)/(N-1)) 410 KR=KR +12 420 NEXT J 430 G=G+Z(KQ) 440 NEXT I 450 CR=1200/G 460 PRINT TAB(1);"MONTH";TAB(17);"AVERAGE" 470 FOR I=1 TO 12 480 PRINT MO$(I),Z(I)*CR :REM ANSWERS 490 NEXT I 500 PRINT 8000 DATA 7.5, 7.6, 7.5, 7.7, 8.5, ˜ 8.6 8005 DATA 8.6, 8.6, 9.0, 9.1, 9.0, ˜ 8.5 8010 DATA 8.9, 9.0, 9.2, 9.2, 9.1, ˜ 9.2 8015 DATA 9.7, 9.7, 10.2, 10.3, 10.4, 10.2 8020 DATA 11.0, 11.5, 11.7, 12.0, 12.1, 11.5 8025 DATA 11.0, 11.5, 12.0, 12.5, 13.5, 14.5 8030 DATA 15.0, 16.0, 15.9, 16.5, 16.3, 15.5 8035 DATA 15.4, 14.0, 13.0, 12.5, 12.6, 13.0 8040 DATA 14.9, 16.0, 17.0, 17.8, 19.0, 19.0 8045 DATA 20.5, 22.5, 22.6, 22.8, 22.0, 24.0 8050 DATA 25.0, 23.8, 22.0, 24.0, 27.2, 29.5 8055 DATA 28.5, 26.5, 29.5, 30.8, 31.5, 33.0
Program 2: Atari Version
Minor changes were necessary to convert this program to run in Atari BASIC, such as string array simulation for the reading of the twelve months of the year. Because Mr. O'Dell has the months padded to the right with spaces, this is easy. Note the period at the end of each month in lines 50-80. This is necessary to preserve the trailing blanks in some of the items. The period makes the string ten characters long, but, because T$ was only DIMensioned for nine characters, that's all that is read in. The POKE 85,n simulates a TAB statement. — The Editors
Make these changes to the Microsoft version:
48  DIM IN(240), SM(240), Y(240), Z(12), MONTH$(9*12), T$(9)
50  DATA JANUARY ., FEBRUARY .,MARCH	.,APRIL		.
60  DATA MAY		.,JUNE		.,JULY	.,AUGUST	.
70  DATA SEPTEMBER.,OCTOBER .,NOVEMBER .,DECEMBER	.
80  FOR I=1 TO 12
90  READ T$:M0NTH$(I*9-8,I*9)=T$
100 NEXT I
160 READ TEMP:IN(U)=TEMP
460 PRINT " MONTH";:POKE 85, 17:PRINT "AVERAGE"
480 PRINT MONTHS (I*9-8,I*9);:POKE 85, 18:PRINT Z(I)*CR