PLOTting On The Apple
Thomas P. Anderson
How to plot and handle the screen on Apple's high resolution screen. Requires 16K RAM. This machine language routine simplifies screen graphics.
This little study of mine, which began about three months ago, first started after I had written a short BASIC program to plot pictures on the high resolution screen with four lines of text at the bottom. The entire screen memory had to be saved to store the picture on the disk. To avoid this waste of space, I decided to find out the memory locations of the four bottom screen lines. I could then devise a method of saving all screen memory except for those four lines.
I quickly found the necessary addresses, but in the process I also noticed how strangely the screen memory was laid out. There had to be a way of decoding the inconsequent order of screen memory, so that a specific point on the screen could be referenced easily.
How does Applesoft do it? I found absolutely no documentation of this subject. I could have waded through about 8K of disassembled code and still not found the answer, so I was on my own in figuring this one out. In this article, I am relating to you what I have found out about PLOTting on the high resolution screen in machine language.
Base Addresses
First of all, a review of the hi-res screen layout. The screen has a resolution of 192 lines by 280 dots. The lines are referenced by the decimal values 0-191, and the dots are referenced by the decimal values 0-279. The position of (0,0) is in the upper left-hand corner.
Seven consecutive dots of a line are controlled by the value stored in one byte of memory, so 40 bytes are required to control one line. These 40 bytes, referenced by the decimal values 0-39, I will call the column position. The zero column position is the base address in memory of the line. To see what values are necessary to turn on a dot, we have to look at the bit patterns of the controlling byte.
Screen Column Position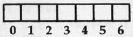
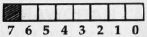
Shown above are seven consecutive dots on the screen and the controlling byte. If bit three of the controlling byte is on, then the dot in position three within the column will be on. Bit seven of the controlling byte will be zero for this article, since I am not concerned here with manipulating the screen colors.
What To Calculate
Once I had reviewed the basics of screen memory, my problem became defined for me. The routines I had to write would take two decimal values: 1) a line number in the range of 0-191, and 2) a dot position in the range of 0-279. From these values the routines would calculate:
- The 16-bit hexadecimal base address,
- The column position in the range of 0-39, and
- The dot position within the column in the range of 0-6.
I will explain the calculation of the base address first, since it is the complicated one. To understand this, I had to know what all the possible base addresses of page two could be. I used page two during the testing because PLOTting on page one wrote over my source file in memory, and it had to be reloaded after every test.
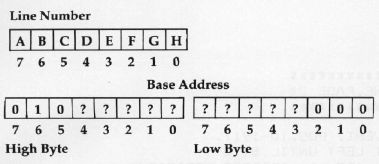
All base addresses lie within the range of $4000-$7FD0. This means that the high byte of our address will be in the range of $40-$7F, and the only possibilities for the low byte are $00, $28, $50, $A8, or $D0. To see how this works exactly, I assigned variables to the bit positions of the line number.
Since we know the maximum and minimum value of the base address, we know that certain bits of the base address will always be off or on no matter what the line number is. Shown below are the assigned variables of the line and the starting framework of the base address.
Figuring Bit Positions
The steps that follow are the ones that I used to figure the bit position of the line that would determine the value of a bit position in the base address.
- Choose a questionable bit position of the base address.
- Determine all the possible values of that byte if the bit is on.
- Determine all the possible values of that byte if the bit is off.
- Determine all the possible values of the line number based on the values found in Step 2.
- Determine all the possible values of the line number based on the values found in Step 3.
- By examining the binary values of the line numbers, the bit patterns are easily seen. There will be one bit position in the values from Step 4 that is always the complement of that same bit position in the values from Step 5. Therefore, this bit position of the line number is the determining bit for the questionable bit in Step 1.
Using these steps for all questionable bits of the base address, I ended up with the representation of the base address as shown below.
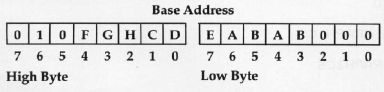
Now that I had figured out the starting and ending representations, I wrote the routine HBASCALC to perform this operation. This routine is shown in Program 1. The routine is entered with the line number in location HCV and exits the routine with the base address in locations HBASL and HBASH. The documentation explains the process and shows how the variable representations are manipulated by each instruction. This routine can be easily changed to use page one by changing the instruction ORA#$40 to ORA#$20 and setting the appropriate soft switches for page one.
That may have been a bit complex; but now that you have the HBASCALC routine, you won't have to follow those steps as I did.
Calculating the column position and the dot position within the column was a simpler task for me. Since there are 280 dots to represent with 40 bytes of memory, I needed to divide the dot position by seven. The quotient would be the column position, and the remainder would be the dot position within the column. At first I used the standard 16-bit by 16-bit division routine, but this process seemed a little slow for PLOTting.
So I tried another routine which simply subtracted seven from the dot position until it went to less than zero. An index register was used to count the number of times seven could be subtracted, which gave me the column position, and then adding seven back to the now negative dot position gave me the dot position within the column.
Being unsure of the speed of this routine, I calculated the time required by each routine to plot 280 positions, one full line, and I found that the second routine used about 120,000 machine cycles less than the standard routine. The faster routine is called DIVIDE and is shown with the demo program (Program 2).
Plotting A Grid
This division process is the most time consuming aspect of hi-res plotting. I learned quickly that if the main driving routine consists of nested loops, as Hi-res Grid Demo does, then the division routine should be used in the outer routine, or the entire routine will be greatly slowed. If the division is performed in the inner loop, it will be executed for every dot plotted. If the division is performed in the outer loop, it will be executed only when the dot position changes.
Program 2, Hi-res Grid Demo, will accept input from the user in the range of 1-9. It then draws the grid with the number input as the number of spaces between each line of the grid. The program PLOTs the grid until it goes off the edge of the screen, and then it goes back and erases the excess plots to make a neater appearing grid. The program will terminate with a CONTROL-C.
Hi-res Grid Demo is fairly simple, but its purpose is to show you the basic routines used in PLOTting with machine language. Perhaps it will stimulate you to look further to other possibilities, such as color PLOTting, line drawing routines, animation, and faster game design than BASIC will allow. I know it has me working on other ideas. As for my original objective, the saving of hi-res pictures without the four bottom lines, I forgot all about that once I discovered the other interesting possibilities at my fingertips.