ATARI CHARTMAKER
Tom R. Halfhill, Features Editor
Here's a relatively short but versatile program you can use to draw charts on the screen with your Atari — charts you customize to fit your own needs.
Why do you need charts? (That's what they used to say about computers, too.) Well, almost every-body has something to chart. I once used this program, for example, to chart weekly interest rates of the two money market mutual funds in which my spare cash was invested. But I purposely designed the program for easy modification so you can chart whatever you want: stock quotes and dividends, pork belly futures, bowling scores, jogging information, sunspot activity — even pounds lost on your diet.
Besides allowing you to draw charts to any scale to fit your own data, the program also includes a subroutine to display your own labels in GRAPHICS 0 text within the GRAPHICS 8 graphics window. And by experimenting with the program in ways described below, you can also learn something about statistical rhetoric — how clever statisticians can manipulate the scales of charts to influence the way you think.
Charts In Hi-Res
The program requires at least 16K, mainly because it uses GRAPHICS 8, which steals 7,900 bytes of RAM off the top before you even start. Another disadvantage of GRAPHICS 8 is that only one color besides the background default is available (disregarding special display list interrupts and other complexities we won't discuss here). It would be nice if different colored lines could be charted to keep track of different arrays of data. However, I used GRAPHICS 8 because it is the highest resolution mode and allows the greatest accuracy when charting lines.
The program draws the chart one point at a time by fetching numbers which you place in DATA statements at the bottom of the program. If you want, you can substitute INPUT loops and numeric arrays for the DATA statements, but I've found it just as fast to add my weekly updates to the DATA rather than to fool around with separate data files and so forth. If your needs differ, replace the subroutine at lines 1500 – 1620 with your INPUT loops.
The scales are easily customized by changing the values of a few variables in lines 50 and 60. Changing only a few numbers in these lines allows you to define the number of points in the scales drawn along all four sides of the chart. In the example program, the vertical borders are divided into 20 points to plot stock prices from $0 to $20 per share. The horizontal borders are divided to represent the 52 weeks in a year. You also define additional markers; in this example, the share prices are subdivided into $5 sections, and the 52 weeks are subdivided into four quarters.
Customizing The Program
Modifying these scales is simple. Let's say you're charting the growth of an Individual Retirement Account from $0 to $10,000 in $250 increments. You need to divide the vertical (Y axis) borders into 40 units (10,000/250). Just change the variable YSCALE in line 50 from 20 to 40. To further sub-divide this scale with markers for every $1,000, just change the variable YMARKERS in line 60 from 4 to 10 (10,000/1,000).
Now let's say you want to chart this growth monthly for two years, rather than weekly for one year, as in the example below. You need to divide the horizontal (X axis) borders into 24 units (2 years with 12 months each). Simply change the variable XSCALE in line 50 from 52 to 24. To sub-divide this scale with additional markers for each quarter, change the variable XMARKERS in line 60 from 4 to 8 (4 quarters per year * 2 years).
The only other thing you have to do is substitute your own data for mine starting at line 2300. You can add as many of these DATA lines as you need to the bottom of the program. Two cautions, however. First, to avoid CURSOR OUT OF RANGE errors, don't try to plot a line off the screen. This means the largest number in your DATA statements must never exceed the value you assign to YSCALE, and likewise the number of data elements must never exceed the value assigned to XSCALE.
Second, to avoid OUT OF DATA errors, always make the very last data element a dummy element, a "flag." A flag is a number which signals something to a computer. In this case, the flag signals the Atari that there is no more data to be read. It then leaves the READ DATA subroutine and finishes the program. The flag is a number (any number) which exceeds the value you assigned to YSCALE (I just told you never to exceed YSCALE, but the program expects it in this case). In the example below, I chose the number 101 as my flag (YSCALE = 20).
The flag also serves another very important purpose. It permits you to draw more than one line at a time on your chart. Again, refer to the example program: It charts two lines for stock prices of two companies. To do this yourself, add a flag to the end of the last DATA statement which draws the first line, then add more DATA statements to chart the second line. Using my investment example, the rates for the first company are in DATA lines 2300 – 2340, and the rates for the second company are in DATA lines 2360 – 2400. You'll notice that each of these series of DATA lines ends with a flag of 101. For each line drawn on the chart, you also need a GOSUB 1500 near the top of the program. Mine are at lines 420 and 440.
You aren't lost, are you? Well, just in case, here's how I would add a third line to my chart. First, I would insert a GOSUB 1500 at line 470. Then, I would put the data in new DATA statements after line 2400, ended with a flag of 101.
To plot just one line, I would delete the GOSUB at line 440 and the DATA at lines 2360 – 2400. It's really very simple if you'll type in the example program and see how it works.
How To Fib With Statistics
Play with my example program a bit before modifying it for your own purposes. Make XSCALE = 104 (2*52) and XMARKERS = 8 (2*4) to draw a two-year chart with weekly and quarterly indices. Or, to draw a three-year chart, make XSCALE = 156 (3*52) and XMARKERS = 12 (3*4).
Incidentally, if your computer is hooked up to a regular TV instead of a monochrome computer monitor, you'll probably experience a phenomenon known as "artifacting" when you try to draw a two- or three-year chart. TV sets lack the resolution necessary to display very fine lines drawn very close together. The week markers along the top and bottom of the chart will merge and create unusual colors not normally possible in the one-color GRAPHICS 8 mode. Some programs use this effect — artifacting — to advantage. In this program, however, it will obscure the lines you're trying to draw. You can avoid this by plotting fewer markers: For a two-year chart, make XSCALE = 24 (2*12) to plot by the month rather than by the week. Even if artifacting obscures your indices, though, it will not affect the charted lines of data.
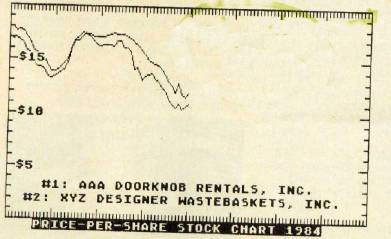
Now, before I explain how to dress up the chart with custom labels, take a few minutes to experiment with these values a moment longer, and you'll see how less-than-honest statisticians could tinker with chart scales to manipulate the unwary. For instance, change YSCALE to 18 and YMARKERS to 3.6 while using the same DATA numbers (ignore the "$5", "$10", and "$15" labels, which now will be mislocated). RUN the program. See how steep the charted lines appear, with high peaks and low valleys? Looks like those stock prices are pretty undependable from week to week, right?
But now change YSCALE to 60 and YMARKERS to 12 (again ignoring the labels), and RUN. Now the lines magically flatten out, and it looks like the prices hardly changed all year.
We used the same DATA numbers, remember, and numbers don't lie — but they can mislead. For example, a politician running for sheriff can make a chart dramatizing that crime rates have sharply climbed during his opponent's term of office, while the opponent can plot the very same numbers on a compressed-scale chart and it will appear that the rates have hardly climbed at all. This program can animate such manipulations and make them graphically obvious.
Text On The Hi-Res Screen
Besides the text window title ("Price-Per-Share Stock Chart 1984" in this example), a special sub�routine at line 1160 prints anything you want in GRAPHICS 0-style text anywhere inside the GRAPHICS 8 graphics window. (You may want to separately save this subroutine using the LIST command to use in your own programs.) Options built into this subroutine let you display your labels almost any way you want, horizontally and even diagonally.
Here's how to use this subroutine. First, define your label as ZA$ in a line number that immediately follows the GOSUB 1500 which reads the associated DATA. Again, refer to the example program. The GOSUB at line 420 reads the first three lines of DATA for the first company's stock prices. Therefore, ZA$ is defined in line 430 as "#1:AAA DOORKNOB RENTALS, INC." When RUN, the program writes this label just after the line of stock prices for this company is plotted.
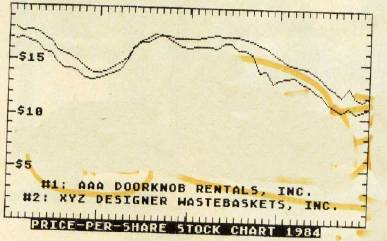
Next, the GOSUB 1500 at line 440 plots the stock prices for the second company: Then, ZA$ is redefined in line 460 as "#2: XYZ DESIGNER WASTEBASKETS, INC.", and this label is drawn. Lines 480, 500, and 520 redefine ZA$ three more times to display dollar labels on the chart. The GOSUB 1160 added onto the ends of all these lines sends the program off to the text subroutine.
Options are chosen by the three variables which must always follow any definition of ZA$. ZX positions the label horizontally on the screen (the X axis); this is a column number from 0 to 39; ZY likewise positions the label vertically on the screen (the Y axis); it is a number from 0 to 191. And, finally, ZZZ is the slant of the label. If ZZZ = 0, as in the example program, the labels are written horizontally. If ZZZ = 1 or if ZZZ = -1, the label is displayed with a right or left diagonal tilt.
By modifying this program in all these ways to display your own text labels and scales, you can adapt it to quite a wide range of uses.