Conic Curve Plotter
Lam-hing Wong
The Commodore 64 is a versatile and powerful computer, but its built-in BASIC has no commands for drawing high-resolution graphics. Here's a program that makes it easier to draw in hi-res by providing commands for a variety of geometric figures.
"Conic Curve Plotter" lets you create lines, angles, arcs, circles, ellipses, parabolas, and hyperbolas on the Commodore 64's high-resolution graphics screen at the touch of a key. It also lets you draw with the joystick and save your pictures on tape or disk.
The 64's hi-res screen normally has 320 horizontal pixels (screen dots) by 200 vertical pixels. In early versions of this program, lines looked like they were at off-angles and circles looked squashed. After taking some measurements with a ruler, I discovered that the length of 9 pixels vertically is equal to the width of 11 pixels horizontally. No wonder things looked skewed.
To remedy this problem, here are three types of screens. Screen 1 is the normal high-res screen with 320 pixels horizontally and 200 vertically. The dimensions of Screen 2 are 320 horizontal and 244 vertical (multiplying the normal vertical length by 11/9). If you want your drawings to appear undistorted, choose Screen 2. Screen 3 allows you to define your own dimensions. For example, you can stretch the drawing horizontally by setting the dimensions to 320 horizontal and 488 vertical.
The screen boundaries are checked for in all drawing modes except the joystick mode. When drawing lines, parabolas, or hyperbolas, the drawing can be stopped manually; otherwise, it stops when it reaches a border. When drawing circles, arcs, or ellipses, you cannot stop the drawing manually. You can speed up the drawing by bypassing the boundary check routine. To do this, change these lines to REM statements: 638, 852, 975, and 4500. But be careful that the drawing does not go beyond the top border of the screen. If it does, the program might crash.

Originally, the program was written entirely in BASIC. It took 27 seconds to erase the high-resolution screen (POKEing locations 8192–16191 with 0), three seconds to set the bitmap background color to cyan (POKEing locations 1024–2023 with 3), and 25 minutes to save or load the screen on tape (using PRINT# and GET#). These time-consuming routines were replaced with machine language, and now clearing the screen and setting the background color are instantaneous. Using Kernal routines to save and load the screen on tape takes about four minutes.
Setting Things Up
At the beginning of the program, you are asked to select a type of screen. After you make your selection, the screen will clear and the high-res cursor (a small dot) will appear in the center.
You are now ready to draw your picture using any of the one-key commands.
Several commands require that you enter additional information such as a screen position or angle. Screen position is specified by entering the X and Y coordinates. X is measured horizontally from the left of the screen. Y is measured vertically from the top of the screen. The top-left corner of the screen is position (0,0). Since the program does not check the coordinates of the points that you enter, be sure to confine them to the screen dimensions you have chosen. Angles are specified in degrees measured counterclockwise from the horizontal.
One-Letter Commands
Pressing A draws a line at a specified angle. You will be prompted for the starting point and the angle. The cursor will keep moving until it reaches the border or until you stop it by pressing any key.
Pressing O draws a line between two points. You will be prompted for the starting and ending points. The cursor can be stopped by pressing the f1 key. Pressing the f3 key switches the draw/erase modes and reverses the direction of the cursor.
C draws a circle or arc. You must specify the radius, center, starting angle, ending angle, and density. To draw a circle, the starting and ending angles are 0 and 360, respectively. Enter a density between .1 and 1, or just hit RETURN to use the default value of .667. The density determines the spacing of the dots plotted. A low density will plot a few dots spaced far apart, while a high density will plot a lot of dots spaced close together.
Pressing I draws an ellipse. You must specify the parameters A and B in the equation X * X / A * A + Y * Y / B * B = 1, the center, the angle of the major axis, and the density. A is half of the major (long) axis and B is half of the minor (short) axis. If A and B are equal, a circle will be drawn with A and B equal to the radius.
P draws a parabola. You will be prompted for the parameter A in the equation X = A * Y * Y, the vertex, the angle of the axis of symmetry, and the density. You can stop the drawing manually by pressing any key.
H draws a hyperbola. You must specify the parameters A and B in the equation X * X / A * A - Y * Y / B * B = 1, the center, the angle of the transverse axis, and the density. Again, you can stop the drawing by pressing a key.
Q queries the location of the cursor, type of screen, and screen dimensions.
T changes the type of screen. This command is executed automatically at the beginning of the program. The previous drawings will not be affected.
M moves the cursor to a specified point. The CLR/HOME key moves the cursor to the top-left corner. Pressing SHIFT-CLR/HOME clears the screen and moves the cursor to the top-left corner.
S saves the screen to tape or disk. L allows you to reload a previously saved screen.
The / key ends the program. To restart the program, type GOTO 15. The previous drawings will not be lost.
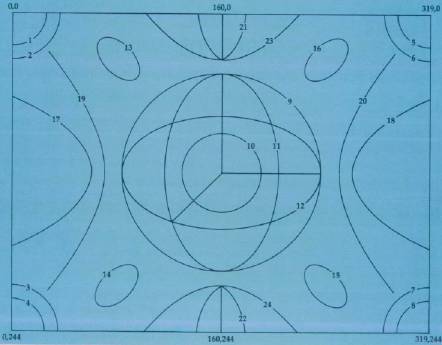
Table 1: Demo-Screen 1
This table lists the data entered when drawing the curves on Demo-Screen 1. The screen dimensions are 320 × 244 (type 2).
| Type Of Curve | Curve No. | Center Or Vertex | Parameters | Angles | Density Of Points | ||
| Init | Final | ||||||
| arc | 1 | (0,0) | R = 25 | 270 | 360 | 0.2 | |
| arc | 2 | (0,0) | R = 35 | 270 | 360 | 0.2 | |
| arc | 3 | (0,244) | R = 35 | 0 | 90 | 0.8 | |
| arc | 4 | (0,244) | R = 25 | 0 | 90 | 0.8 | |
| arc | 5 | (319,0) | R = 25 | 180 | 270 | 0.4 | |
| arc | 6 | (319,0) | R = 35 | 180 | 270 | 0.4 | |
| arc | 7 | (319,244) | R = 35 | 90 | 180 | 0.6 | |
| arc | 8 | (319,244) | R = 25 | 90 | 180 | 0.6 | |
| circle | 9 | (160,123) | R = 75 | 0 | 360 | 1.0 | |
| circle | 10 | (160,123) | R = 30 | 0 | 360 | 0.1 | |
| A: | B: | betw. major axis & horizontal: | |||||
| ellipse | 11 | (160,123) | 75 | 40 | 90 | 0.667 | |
| ellipse | 12 | (160,123) | 75 | 40 | 0 | 0.667 | |
| ellipse | 13 | (80,35) | 20 | 13 | 135 | 0.2 | |
| ellipse | 14 | (80,210) | 20 | 13 | 45 | 0.667 | |
| ellipse | 15 | (239,210) | 20 | 13 | 135 | 0.4 | |
| ellipse | 16 | (239,35) | 20 | 13 | 45 | 0.3 | |
| hyperbola | 17,18 | (160,123) | 100 | 75 | 0 | ||
| hyperbola | 19,20 | (160,123) | 85 | 73 | 0 | ||
| parabola | 21 | (160,40) | A = 0.1 | 90 | |||
| parabola | 22 | (160,206) | A = 0.1 | 270 | |||
| parabola | 23 | (160,40) | A = 0.01 | 90 | |||
| parabola | 24 | (160,206) | A = 0.01 | 270 |
I used the O command to draw three lines that form the Cartesian coordinates. The starting and ending points are:
From (125,168) to (160,123)
From (160,123) to (160,48)
From (160,123) to (235,123)
You can use either the O command or the A command to draw the border lines and the axes of symmetry for the parabolas easily.
The program is divided into two parts. Program 1 POKEs the machine language routines into memory, and Program 2 is the main program. After you have the programs typed in and saved, you can activate "Conic Curve Plotter" by loading and running Program 1, then loading and running Program 2.
Programs 1 and 2 are designed for loading from and saving to tape. If you are using disk instead, make the modifications shown in Programs 3 and 4. Program 3 shows which lines must be changed in Program 1, and Program 4 gives the modifications for Program 2.
Sample Runs
To give you a better idea of how to use the program, Table 1 contains the information used to draw the curves shown in Figure 1. Figure 2 illustrates the effect of using different screen dimensions. Four circles were drawn using the C command. Between drawings, the T command was used to change the screen dimensions. The parameters used for each curve are given in Table 2.
Table 2: Demo-Screen 2
On this screen, four shapes were drawn using the C command. Between drawings, the T command was used to redefine the screen dimensions.
| Curve No. | Center | Radius | Density Of Points | Screen Dimensions |
| 1 | (160,100) | R=90 | 0.2 | 320 × 200 |
| 2 | (160,123) | R=90 | 0.4 | 320 × 244 |
| 3 | (160,160) | R=90 | 0.667 | 320 × 320 |
| 4 | (320,244) | R=90 | 0.667 | 640 × 488 |
The following is a line-by-line explanation of Program 2.
| Lines | Explanation |
| 14 | Call machine language routine to clear high-res screen. |
| 17 | Turn on text mode. |
| 18–19 | Read joystick directional values. |
| 20–30 | Define screen dimensions. |
| 35 | Call machine language routine to turn on bitmap mode and set background color to cyan. |
| 40–42 | Define functions that calculate BY,BI given X,Y. |
| 90–190 | Joystick routine. |
| 300–350 | Check-boundary routine. |
| 400–410 | Take away the erased bit and POKE the byte with the remaining bits. Called whenever something needs to be erased. |
| 600–640 | Command A routine. |
| 638 | Call boundary-check routine. |
| 800–860 | Parabola routine. |
| 900–990 | Hyperbola routine. |
| 960–972 | Calculate and plot points on four branches. |
| 1000–1190 | Command O routine. |
| 1100–1110 | Determine horizontal and vertical increments: DX & DY. |
| 1170–1176 | Check to see if one component (x or y) has reached the end point. |
| 1180 | If S$ is f1, stop. |
| 1182 | If S$ is f3, reverse everything. |
| 1200–1230 | Command M routine. |
| 1300–1400 | Obtain data to draw circle, arc, or ellipse. |
| 1405–1492 | Calculate points of circle, arc, or ellipse. Notice that the FOR-NEXT loop is incremented by radians (DR), and that DR is a variable depending on a parameter specified by the user and on the radius. |
| 1520–1550 | Draw or erase an ellipse's foci. |
| 3000–3080 | Call machine language routines to save the high-res screen. |
| 3100–3110 | Call machine language routines to load the high-res screen. |
| 3220–3250 | Command Q routine—display cursor and screen dimension information. |
| 4000–4570 | This routine calculates points to be plotted or erased (takes rotating into account). |
| 4450–4460 | Calculates point positions after the axes were rotated. |
| 4500 | Call boundary-check routine. |
If you don't want to type in the program, just send me $3, a blank cassette, and a self-addressed, stamped mailer. I will send you the program and two demo-screens along with full documentation.