Math Graphics For The IBM PC
Jay Seaver
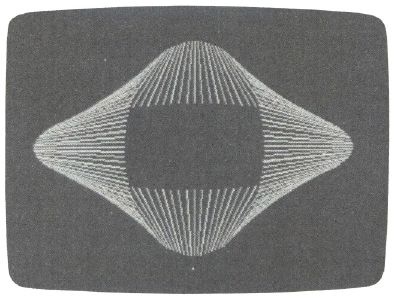
If you think that math is boring, then you have a pleasant surprise in store. With these two programs you can either custom design your own dazzling Math Graphics or you can sit back, let the computer do all the work, and enjoy a beautiful graphics show. A color / graphics adapter or equivalent hardware is required, along with BASICA for the PC or GW-BASIC for compatibles.
While your computer can't create pictures without a paint program, a graphic pattern—which can be the result of a mathematical formula—is often surprisingly easy to create. In fact, if you have a flexible formula, you can create thousands of images by simply varying the formula.
One program that has done this well is "Math Graphics," versions of which have been published in COMPUTE! for three different computers: Amiga, Apple II series, and Atari ST. Because of the beautiful graphics generated by this program, I decided to design a PC version, but with a major enhancement, "Math Graphics Construction Set."
Getting Started
Since both "Demo" (Program 1) and "Construction Set" (Program 2) are written entirely in BASIC, just type each one in and save a copy of each to disk. To see the demonstration program, load it, type RUN, sit back, and enjoy.
If the demonstration program piques your interest in creating graphics of your own, you'll want to explore the Construction Set program. When you first run the Construction Set, you'll see a large menu. Understanding this menu is the key to using the program.
Constructing Math Graphics
When you first run the Construction Set, the menu's 19 numbered options have values assigned to them. The prompt at the bottom of the screen asks you to Enter number to modify, 20 to RUN, 21 to QUIT. By typing the number of one of the options and then, when prompted, the new value you wish to assign it, you change the way the final picture is formed. To see the default Math Graphic, choose option 20 from the menu. If you want to return to the menu before the Math Graphic is finished forming, simply press any key. Let's take a look at each option.
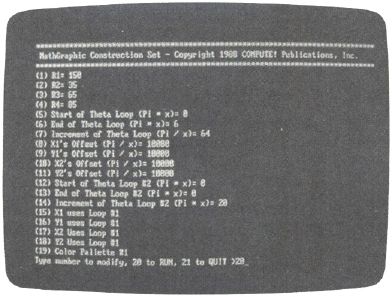
Options 1-4 are the R values, which define the shape of the graphic. Note that Rl, R2, R3, and R4 modify X1, Y1, X2, and Y2, respectively. To get an idea of how to use the construction set, change the value of Option 1 to 20 and then view the graphic.
Options 5 and 6 define the limits of the theta loop in terms of pi. If the difference between these values is exactly 2, the picture will be drawn once and won't be retraced. If the difference is more than 2, parts or all of the picture will be retraced and will change color. If the difference is less than 2, an incomplete drawing will result.
Option 7's value is divided into pi to determine how quickly the theta loop proceeds from one end to the other. If Option 6 is less than Option 5, Option 7 should be a negative number. To see how this parameter changes the image, try changing the value of Option 7 to 8 and view the graphic.
Options 8-11 are the offsets for X1, Y1, X2, and Y2, respectively. Because each value is divided into pi, the lower the number, the larger the offset. The default for these options is 10,000, so any offset will be imperceptible.
Options 12 and 13 are the start and end of a second theta loop. Use these options like 5 and 6 above.
Option 14 is the increment for the second theta loop. Use it just like Option 7.
Options 15—18 decide which theta loops X1, Y1, X2, and Y2 will use. If you don't want to use the second theta loop at all, set all of these to 1. Changing these values can produce dramatic, exciting changes in your graphics. For example, exit the program by choosing option 21 from the menu and type RUN (or Press F2), so you'll start with the Construction Set's default values in place. Now change Option 13 to 6, so you'll have a second theta-loop value, and change both Options 15 and 18 to 2, so they each use the second loop. Now you can view the graphic.
Option 19 lets you choose which color palette to use. It accepts a number from 0 to 3. See the table for the colors associated with each number.