THE ASTRONOMER
YOUR COMPUTERIZED GUIDE TO THE HEAVENS
by Ignac A. Kolenko Jr.
Move over, Carl Sagan! Even if you can't say ''billions'' with a plosive ''b,'' you can still pick out those bits of star stuff from the rest of the cosmos. All you need to find your way around the night sky is a clear view, your ST and the aSTronomer, a universe-mapping program you'll find on your START disk.
File ASTRO.ARC on your START disk
As an amateur astronomer, the last thing I want to do before an evening of observing is to leaf through an astronomical magazine or almanac, searching for planetary positions, star maps, and other such items. I also don't care to spend five hours wading through massive spherical trigonometry formulas to get the information I want. Wouldn't it be easier, I thought, just to run a program on my ST, enter the current date and time, and in a matter of minutes have star maps and printouts of planetary positions? This is how the aSTronomer was born.
The astronomer is an easy-to-use GEM-based program written in Personal Pascal. I chose Personal Pascal because of its extensive support of GEM, and wrote the program with the user in mind. All keyboard input is done using dialog boxes, which helps eliminate inadvertent errors (such as entering a string when an integer is asked for), and all questions the program asks are answered with alert boxes. All program output can be sent to either the screen or the printer (which you can configure from a menu option). The program also works in both medium and high resolutions.
The aSTronomer can do many things that an amateur astronomer will find useful, and things that a beginner will find educational. With a few clicks of the mouse you can:
- select the latitude and longitude of your observing site anywhere on the
Earth;
- select the time and date you want information for, over 100 years in the
future, or hundreds of years in the past;
- print the positions of all the planets, Moon, Sun and nine different
comets; and
- draw three different types of star maps, accurate and ready to use!
THE OLDEST SCIENCE
The science of astronomy is an ancient one. Since earliest times, man has wondered about the twinkling lights in the sky--why some of them moved as others remained stationary, why the Moon appeared to grow and shrink in size each month, and why the Sun seemed to disappear occasionally, swallowed by a blackened disk with a shimmering halo in an eclipse. Ancient civilizations began to record such celestial events in calendars, and began formulating ideas about how the universe was structured. One noted Greek astronomer, Hipparchus, mapped the constellations and estimated the brightness of the stars; another, Ptolemy, devised the Earth-centered view of the universe where everything, including the Sun, planets and stars revolved about the Earth.
The ideas of the early Greeks stayed with us for nearly two thousand years until the Renaissance, when Copernicus, Kepler and Galileo gave us a more accurate understanding of how the universe is structured. Since then, discoveries such as the planets Uranus, Neptune, and Pluto, the rings about Uranus and Jupiter, the explorations of the planets and the Moon by both U.S. and Soviet probes, and the periodic hype surrounding Halley's Comet have kept astronomy in the public's eye, and powerful radio-telescopes constantly scan the skies for new discoveries. But even after thousands of years there's still plenty for an ordinary person to see!
Many people living in large cities have never really taken the time to appreciate the beauty of the night sky. For most of them, a simple trip to the country with a pair of binoculars (or even just the naked eye) is enough to open the grandeur of space for them. With an Atari ST computer, the aSTronomer should help you see ahead of time what celestial items of interest are worth looking for, and to continue the fascination with the night sky that has been with us since man first appeared on Earth.
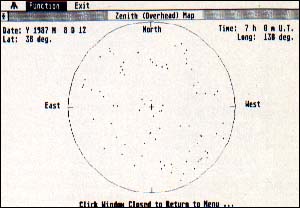 |
| A typical Zenith Map |
WHAT'S UP, DOC?
First, a few terms and facts.
What's up there? You've seen the Sun and the Moon; only a little more difficult to spot are the planets. The planets look like stars, but they seem to move slowly around the sky from week to week--and they don't twinkle as the stars do. The planets Mercury and Venus are known as either "morning stars" or "evening stars"; they seem to stay close to the Sun, and are usually the first or last objects you'll see in the night sky (more often Venus than Mercury, since Venus is far brighter). Jupiter usually dominates the night sky, because it is also a very bright planet. Saturn is a visual feast because of its rings--you can see them easily with all but the smallest telescopes! Mars is occasionally bright enough to be dominant in the night sky and presents many interesting views (though, contrary to tradition, there are no canals or Martians to speak of!). The other planets in the Solar System are usually too faint to be seen easily by beginning astronomers.
Also in our Solar System are comets and meteors. Comets are "dirty snowballs," as Halley's Comet was so affectionately described: large balls of dust, ice and gasses, which hurtle toward the sun and then fly back out to deep space on a regular cycle. (There are a few comets, such as Encke, which have orbits similar to the planets.)
Meteors are usually called "shooting stars," and can be seen on practically every night of the year as bright streaks of light. On certain nights of the year, tens or even hundreds of meteors may be seen per hour at night. These displays are called "meteor showers"; they happen when the Earth passes through clouds of dust and debris left behind by the passage of comets. An excellent shower for the northern hemisphere occurs each year around August 11. Called the Perseids, since the meteors radiate outward from the constellation Perseus, this shower can produce up to 60 meteors per hour if you watch it in a dark site out in the country. Meteors are easy to watch, since all you need is a lawn chair and a blanket to keep warm!
Occasionally, if you live far enough north or south of the equator, you may be able to catch aurorae (northern or southern lights). Unfortunately, these are not easy to predict, since they depend on magnetic activity in the Sun.
Finally, there are the stars. With binoculars, thousands of extra stars are visible, and in a clear sky the Milky Way is especially breathtaking to scan with binoculars. If you look closely enough, lots of stars that seem to be single to the naked eye turn out to be double or triple (an example of this is the second star in the handle of the Big Dipper, a double known as Mizar and Alcor). With a larger telescope, it's easy to study nebulas and galaxies. It becomes apparent. with just a sweep of the sky with a pair of binoculars, that there is much more to the sky than twinkling stars--that there's literally a whole universe just waiting to be examined by those who will take the time.
STAR TALK
Before we get into the program, a little astronomical jargon. First, you can specify where stars are either by their altitudeand azimuthor by their right ascensionand declination.
The altitudeis the angle above the horizon. At the horizon, the altitude is zero; halfway up, the altitude is 45 degrees; directly overhead, the altitude is 90 degrees. The azimuthis the compass direction--zero degrees is north, 90 degrees is east, 180 degrees is south, and 270 degrees is west.
A handy rule of thumb is that a clenched fist held out at arm's length is about ten degrees across. Thus if (at a particular time) Venus is at 20 degrees altitude, 260 degrees azimuth, you would face almost due west and look for Venus about two fists up from the horizon.
Another system is equatorial coordinates, using declination and right ascension. To get an idea of how they work, imagine that the sky and the earth are giant concentric globes, both turning on the same axis. Just like the earth, the sky has an equator, a north pole and a south pole. It also has latitude lines running parallel to the equator, and longitude lines running from pole to pole.
The latitude lines are called declination(abbreviated Dec.). Like regular latitude, it's the angular distance from the equator--up to 90 degrees north or south. Zero degrees declination is directly above the equator, while 90 degrees north is directly above the north pole, and 90 degrees south is above the south pole.
The longitude lines are called right ascension(abbreviated R.A.). Instead of being measured in degrees, it's measured in hours, minutes and seconds; the distance all the way around the "globe" of the sky is exactly 24 hours, and the zero point is located in the constellation Pisces.
Equatorial coordinates are used mainly for plotting star maps. The aSTronomer's Star Atlas menu option lets you choose a right ascension and declination to see what objects are in any section of the sky.
Astronomy also has two ways of keeping track of time: Universal time and Sidereal time. Universal time(abbreviated UT) is just Greenwich Mean Time--the current time at the observatory at Greenwich, England. By quoting times in one known time zone, it's easy to convert times for other locations. For instance, Eastern Standard Time is five hours earlier than UT; thus 7 PM. EST is midnight UT.
Sidereal time,or "star time," is just the right ascension of whatever star is directly overhead. Remember, depending where you are, a different set of stars will be directly overhead at any given time, so sidereal time is not an efficient way of reporting astronomical events, it's usually used for orienting large telescopes to locate particular stars.
This isn't a complete introduction to astronomical terms, but it should make a little easier for you to use the aSTronomer Now, on to the program!
RUNNING THE PROGRAM
To run the aSTronomer, first un-ARC the files in ASTRO.ARC. Then create a new folder named ASTRONOM.Y, and copy HELP.DOC and the six .DAT files into the folder. Finally, double-click on ASTRONMY.PRG, and you're ready to go.
The first time you run the program, just try this: Under the Location menu set the location to your own latitude and longitude, and with the Clock menu set the date and time (remember, it's in Universal time). Now choose Sky Plot from the Almanac menu, and your ST will plot a view of the sky on your screen. By pressing Alt-Help, you can print the map on your printer.
That may be all you'll ever need the aSTronomer for--but there's more information in the other menu options . You can explore the program by moving the mouse across the menu bar, and as you do, you'll learn a lot more about astronomy, too.
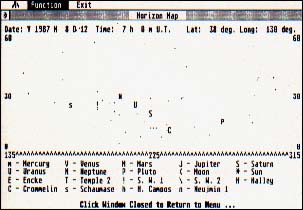 |
| A typical Horizon Map |
THE MENU OPTIONS
Desk
the aSTronomer--show program information
Options
Print Out--toggle printer output for Solar System table of values
Set Printer--select printer for screen dumps
White Screen--toggle white-on-black or black-on-white star maps
Help File--get on-line help
Quit--return to Desktop
Location
Latitude--enter latitude in degrees, minutes and seconds North or South
Longitude--enter longitude in degrees, minutes and seconds East or West
Clock
Date--set date
Time (UT)--set time in Universal time
Almanac
Solar System--calculate table of positions for solar system
Sky Plot--plot star map as Horizon Map, Zenith Map, or Star Atlas
Most of the options are straightforward. Remember that you must set the time to UT, not your local time. In New York, add five hours to your local time; in Chicago, add six hours; in Denver, add seven hours; in San Francisco, add eight hours; and in Saudi Arabia, subtract four hours.
The Sky Plots may take a minute or more because so much data must be manipulated. There are three different versions: Horizon Map, Zenith Map, and Star Atlas.
The Horizon Map lets you choose a direction to look (the azimuth) and then displays the sky as it appears from the horizon up to 60 degrees altitude. The Horizon Map also superimposes the positions of the planets, comets, Sun and Moon on the star map.
The Zenith Map shows the entire sky at once (this is the type of map that's published in newspaper astronomy columns). If you use black stars on a white screen, its easy to print out the Zenith Map using Alt-Help. It's one of the easiest ways to get a star chart to compare with what you see in the sky.
Finally, the Star Atlas is a highly detailed star map. Unlike the Horizon and Zenith maps, the Star Atlas just gives you one section of the sky, which you specify by right ascension and declination. The sample coordinates will create a star plot of the constellation Orion and the area around it.
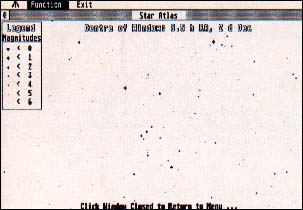 |
| The constellation Orion from the Star Atlas |
That's how to use the aSTronomer. As I said before, it's fun to experiment; you can see the results of plots made an hour apart, or a day apart, or a month apart. With this program, it's extraordinarily easy to create a map of exactly the night sky you want to look at.
SPECIAL FEATURES
The formulas used in this program are standard astronomical and spherical trigonometry. For those interested in learning more about the formulas used, consult books such as Practical Astronomy with Your Calculator, by Peter Duffett-Smith (Cambridge University press, 1979), or The Observer's Handbook (University of Toronto Press, yearly).
Since Personal Pascal doesn't have any built in functions to convert from numbers to strings and vice versa, I had to devise my own. The more useful of the two functions turned out to be Val (Snumber: string): real, which converted the string Snumber into a real number. This was needed since the data returned by dialog boxes are in string format, and I needed a way to convert those strings to numerical data. Also, all the data in the files in the ASTRONOM.Y folder are in text format, I needed a way to convert them from text to real number format.
The other useful procedure was my version of the C function itoa( ), itoa (x: integer; var s: string), which converts an integer (positive or negative) into a string of length up to six. I needed this to convert the system date and time into strings for the date and time dialog box defaults and for the table of Solar System data.
Other features include the use of BIOS, XBIOS and GEMDOS calls directly in the Personal Pascal code. This allowed such things as accessing the system date and time, getting the resolution of the screen, setting the printer port and getting single key input. Also, the built in VT-52 emulator in the Atari ST computer came in handy for the PrintAt (x,y: integer) procedure, which was used to place the cursor at an (x,y) position on the screen.
For the plotting routines (in the Sky Plot section), the Horizon Map plotting routine is quite simple to understand. The horizontal azimuth coordinates are compared to the limits of the horizon to be plotted, and the altitude coordinates are checked to see that they are between 0 and 60 degrees. It is then a straight translation of those coordinates into (x,y) plotting coordinates.
The Zenith Plot is slightly more complicated. It takes the horizontal coordinates from the star database called CONST.DAT It then converts those coordinates (which are, in mathematics, just polar coordinates) into Cartesian coordinates, which are easy to scale to the screen resolutions.
The Star Atlas was by far the hardest to accomplish. It involves taking the equatorial coordinates of the large star databases (called S_RA.DAT, S_ DEC.DAT and S_MAG.DAT) and converting those spherical coordinates into three-dimensional Cartesian coordinates (x,y,z). These coordinates are first rotated in the (x,y) plane by an angle equal to twelve hours right ascension minus the right ascension of the window center. Then the coordinates are rotated in the (x,z) plane by an angle equal to the declination of the window center.
The three dimensional coordinates are then reconverted back to right ascension and declination (equatorial coordinates), and a simple conversion routine plots the stars onto the screen without distortion. The rotations must be performed; otherwise you get an unacceptable amount of distortion as you plot closer and closer to the north and south celestial poles. (It's like the distortion you find on a Mercator map of the world, which always shows Greenland much larger than Australia, whereas the opposite is true.) The rotations make it possible to plot the sky as if it were centered about 12 hours right ascension, 0 degrees declination, which can be plotted easily without distortion.
For these rotations, all angles are calculated before entering the loop that goes through the entire star database, and thus speeds up plotting. Unfortunately, since rotations invariably use trigonometry functions (sines and cosines), plotting slows down, but not tremendously. The stars are plotted in relation to their brightness (that is, the brighter the star, the larger the dot that is plotted). This is done by comparing the magnitude of the star from the large star database.
THE DATA FILES
The PLANETS.DAT file is a sequential data file consisting of the orbital elements of each of the planets in the Solar System. Each planet has an entry which is structured as follows: name, period of revolution (years), longitude at the start of 1980 (degrees), longitude of closest approach (degrees), eccentricity of the orbit, semi-major axis of the orbit (astronomical units), inclination of the orbit (degrees), longitude of the ascending node (degrees), angular size at one astronomical unit (arc seconds), and a brightness factor. A good astronomical manual can further explain each of the above orbital elements.
The COMETS.DAT file is also a sequential data file with the following structure: name, year of closest approach, longitude of closest approach (radians), longitude of ascending node (radians), period in years, semi-major axis (astronomical units), eccentricity of orbit, and the inclination of the orbit (radians). The cometary data is, unfortunately, very prone to obsolescence, since the larger planets, Jupiter and Saturn, have enough gravitational pull to change the orbital elements from time to time. If the data does change, then I will make every effort to get a new data file out to replace the old one.
The CONST.DAT file holds the values for the right ascension and declination of over 150 of the brightest stars, which are used by the Horizon Plot and Zenith Plot menu options. The format for this file is: right ascension (in hours), and declination (in degrees).
The file S_RA.DAT is another sequential file which contains only the right ascensions of over 1500 stars. The format for each entry is HHMM.M, which means that the first two characters are hours, the next two are minutes and the final is a fraction of a minute. Thus, if an entry is 01588, the right ascension of that star is one hour, fifty-eight point eight minutes.
The S_DE.DAT file, which contains declinations, is set up much the same way. Each of the star entries have a format of SDDMM, where S is the sign of the declination (either positive for north or negative for south), DD for the degrees, and MM for the minutes of arc.
Finally, the S_MAG.DAT file contains the magnitudes or brightnesses of each of the over 1500 stars. Each of the entries just consists of a number, positive or negative, corresponding to the magnitude of that star. The smaller the number, the brighter the star.
The HELP.DOC file is simply an ASCII text file.
AD ASTRA
If the aSTronomer increases your interest in astronomy, just go to your nearest library and read up on mankind's oldest, and still perhaps most interesting, science. I hope that amateur astronomers will find the data generated by this program an excellent supplement to their studies, and that beginning astronomers, and people with no previous interest in astronomy, will be able to pick up new information and gain an appreciation of the starry heavens.