ON DISK
Programming In True BASIC
Part III: Windows and Graphics
BY DELMAR E. SEARLS
Enjoy a dynamite tutorial with GRAFDEMO.ARC on Side 1 of your START disk.
(Editor's Note: This issue START continues its series on True BASIC with a special on-disk tutorial of True BASICs window and graphics functions. To run the demo, first boot this month's START disk. The new START menu program runs automatically. At the main screen, click on Prepare, then select "True BASIC Graphics Demo." The program will un-ARC directly onto the destination drive you specify. Read the column for an overview of True BASICs graphics commands, then double-click on GRAFDEMO.PRG from medium or high resolution to run this demo. It describes these commands in more detail and shows them in action.)
True BASIC Windows
True BASIC programs can run on a number of different machines, so its windows are not standard GEM windows. (There are ways to access GEM's windows and we'll look at them in a future article.) A window is a portion of the screen that is treated as if it were the display device. For example, scrolling text is confined within a window and graphics elements are restricted to the boundaries of the active window. Any portions of a graphic display beyond the boundaries are automatically clipped. The size and location of the window is determined by the programmer.
 |
| The True BASIC Graphics Demo is a complete stand-alone tutorial. It not only shows you how a command is written, it also shows it in ac- tion! Even if you're not a programmer at heart, you'll enjoy running this demo. Who knows?, you may want to start in programming after watching this tutorial. |
The location of ordinary text within a window is based on row and column position. Graphics elements (including text which is plotted rather than printed) are located on the basis of the window's coordinate system.
A window's coordinates range from zero to one both horizontally and vertically. The default window is known as window #0 and includes the entire screen area.
True BASIC makes use of channels (pathways) to disk files, the printer, and windows. Here is the statement used to open a window:
Open #<channel>: Screen <left>, <right>,<bottom>,<top>
I'm using <> to enclose parameters that must be supplied by the programmer. For example,
Open #1: Screen 0,0.5,0,0.5
would create a window in the lower left corner of the screen exactly one-fourth the size of the default window.
The Clear statement clears the active window. The Set Window <xmin>, <xmax>,<ymin>,<ymax> statement lets you establish window coordinates for the active window.
To make a window active use the statement Window #<channel>, where channel refers to an open window. The programmer is responsible for saving and restoring the contents of any window(s) that may be covered by the active window. This is easily done using the Box Keep statement discussed below. To close a window use the Close #<channel> statement.
Plot Statements
True BASIC's graphics statements can be grouped into several categories, the first of which includes the Plot statements.
Plot Points: <x1>,<y1>;<x2>,<y2>;
Plot Lines: <x1>,<y1>;<x2>,<y2>;
Plot Area: <x1>,<y1>;<x2>,<y2>;
In Plot Points, the points listed will be plotted. The coordinate pairs are separated by semicolons and you can list as many as you want.
Plot Lines will connect the points in dot-to-dot fashion. If the previous Plot Lines statement ended with a semicolon, a line will also be drawn from the last dot in the previous statement to the first dot in the current statement.
Plot Area will create a closed region by connecting the last point to the first. It will then fill in the region with the current foreground color. However, if the lines connecting the dots criss-cross, the fill comes out a bit differently than you might expect.
Plot Text, At <x>,<y>: <text expression> lets you plot text at coordinate x,y in the active window. The point determines the lower left corner of the text.
There are also three Plot statements that require a two-dimensional array as a parameter. The first dimension (the rows) corresponds to the number of points in the array. The second dimension (the columns) is always two (2). Column 1 corresponds to the x-coordinate and column 2 the y-coordinate The statements are:
Mat Plot Points: <array name>
Mat Plot Lines: <array name>
Mat Plot Area: <array name>
and they perform the same functions as the regular Plot statements above. The only difference is that they will do so for all of the the points in the array parameter.
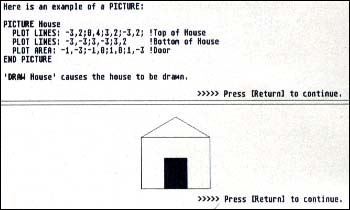
Picture This
A Picture is the graphical equivalent of a subroutine. Any of the Plot statements can be used in a Picture. To cause the Picture to be drawn, use the statement Draw
Plotted text is always the same size and printed horizontally, however. Only the position of the lower left corner is affected by the transformations.
Box Statements
The first four Box statements have a similar syntax:
Box Lines <xmin>,<xmax>,<ymin>, <ymax>
Box Ellipse <xmin>,<xmax>,<ymin>,<ymax>
Box Area <xmin>,<xmax>,<ymin>, <ymax>
Box Clear <xmin>,<xmax>,<ymin>, <ymax>
The parameters are expressed in window coordinates and define a box shaped region. Box Lines draws the border of the box. Box Ellipse draws an ellipse inside the box. Box Area fills the box with the foreground color. Box Clear fills the box with the background color. These are significantly faster than Plot statements.
There are two statements that let you save and recover portions of the display.
Box Keep <xmin>,<xmax>,<ymin>, <ymax> In <string variable>
To save a portion (or all) of a window, identify the corners of the box and use the Box Keep statement. To recover what you've saved use
Box Show <string variable> At <xmin>, <ymin>
where xmin and ymin determine the lower left corner of the box and the string variable is the same one used in the Keep statement. These two statements can be used to generate simple animation or to facilitate window management.
Get it Right
There are two Get statements:
Get Point: <x>,<y>
Get Mouse: <x>,<y>,<state>
The first waits until you click the left button and then returns the location (in window coordinates) of the mouse cursor. The second statement immediately returns the position of the mouse and the state of the left button (no button, button pressed down but not yet released, button just now pressed down and button released).
Graphics libraries
In addition to the statements discussed above, True BASIC (Version 2.0) includes three libraries of graphics-related routines. These routines are written in True BASIC and can be used in your programs. At the beginning of your program you have to list the names of the libraries that will be used in a LIBRARY statement. From then on, you can use them just as you would any routines you might write yourself.
The GRAPHLIB library includes subroutines to print an arc of a circle, to draw coordinate axes, to draw bars (for bar charts), to plot a function (you declare the function as part of your program), to draw a box around the active window and to draw an n-sided polygon inside a box.
The ARC library includes Picture definitions that draw arcs, sectors, wedges (filled sectors), and disks (filled ellipses) in a box. Relplot includes routines that perform relative plotting instead of absolute plotting. For example, instead of plotting a line to a specific point you plot a line to point that is five units up and 20 units to the right of the last point.
True BASIC also sells additional graphics libraries. One has three-dimensional routines and others are available for business graphics and scientific graphics. (Not every library is available for every machine.)
Delmar Searls lives in Wilmore, Kentucky and was the author of Grapher in the Fall 1987 issue of START.